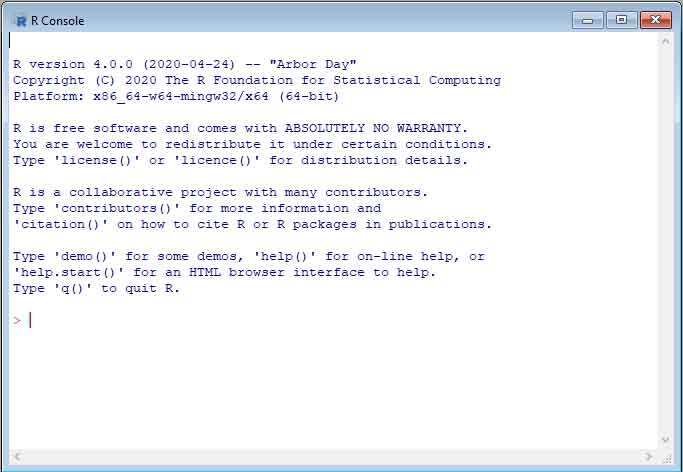
Data visualization is a critical skill for anyone that routinely using quantitative data in his or her work – which is to say that data visualization is a tool that almost every worker needs today. One of the critical tools for data visualization today is the R statistical programming language.
Getting Started with Data Visualization in R


